Otdr and olts two different tools for specific needs
OTDR AND OLTS TWO DIFFERENT TOOLS FOR SPECIFIC NEEDS
When referring to outside plant test instruments, managers are often hear to say, "Why should I measure loss with an optical loss test set(OLTS) when an optical time domain reflectometer (OTDR) gives me a value for optical loss?" While these instruments seem to take similarmeasurements, they serve different purposes; the choice between them depends largely on the specific needs of end users. This article, willexplain the differences between these instruments, paying attention to the specific applications of each tool and how loss measurements areobtained with each. We wish to provide managers with a clear picture of what to expect from each tool and thus enable them to decide whichis better suited to the job at hand. What Does an OLTS Do?
An OLTS is a highly accurate tool that determines the total amount of loss or attenuation in a fiber span under test. At one end of the fiber, astable light source emits a signal that consists of a continuous wave at a specific wavelength. At the other end, an optical power meter detectsand measures the power level of that signal. To obtain accurate results, the power meter must be calibrated for the same wavelength as theincoming signal. In very general terms, the difference in power level of the signal measured at the transmitting and receiving ends correspondsto the loss of the fiber under test.
One advantage of measuring loss using an OLTS is that you can have bidirectional test results, since you need a technician at each end ofthe fiber under test. Bidirectional testing is important for several reasons. First, attenuation through couplers can significantly differ in eitherdirection. Second, fiber core mismatches will produce different attenuations, depending on the direction of the measurement. Third, the qualityof the connectors at both ends of the network may vary. If you use wide-area detectors, all the light at the end face of a scratched connectorwill be detected; however, the fault will not appear. Two technicians, each equipped with an OLTS at both ends of the fiber under test, willobtain more accurate loss results than could have been obtained with an OTDR. What about an OTDR?
On the other hand, an OTDR identifies and specifically locates individual events in a fiber-optic span, which typically consists of sections offiber joined by connectors and splices. An OTDR test is a single-ended test performed by one technician. An OTDR transmits pulsed lightsignals along a fiber span in which light-scattering occurs due to discontinuities such as connectors, splices, bends, and faults. The OTDRthen detects and analyzes the parts of the signals that are returned by Fresnel reflections and Rayleigh backscattering. Fresnel reflections aresmall portions of light that are reflected back when light travels through materials of differing indexes of reflection. Rayleigh backscattering arereflections that result from light scattering due to impurities in the fiber.
These signals, which are detected by the OTDR's avalanche photodetector (APD), enable technicians to draw a trace of signal power receivedversus the time since the pulse was launched into the fiber. From this trace, an OTDR can calculate the end-to-end loss of the fiber. A Detailed Look at OTDR Loss Measurements
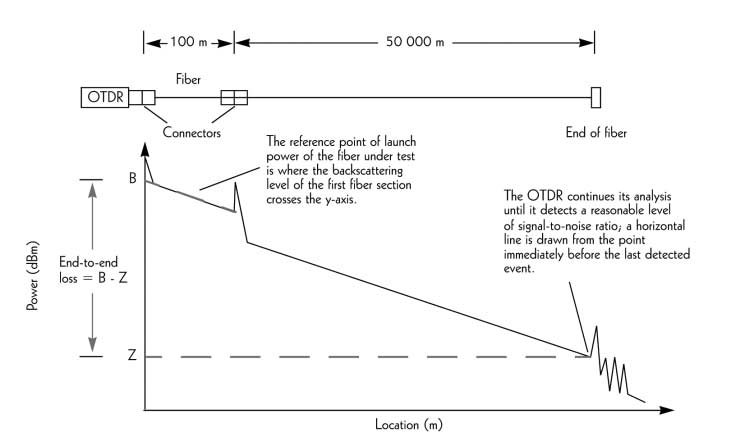
Note that end-to-end loss measurement is taken in a very precise manner. When measuring loss with an OTDR, the launch power is not anabsolute value but rather a reference value. The reference point or launch power of the fiber under test occurs where the backscattering levelof the first fiber section crosses the y-axis (point B in Figure 1). As for the point at the other end of the fiber, it is considered to be locatedimmediately before the last event of the trace. The OTDR continues its analysis until the signal reaches the noise floor (where surroundingoptical noise drowns out the signal); a horizontal line is drawn from the point immediately before the last detected event. The point at whichthis horizontal line crosses the y-axis corresponds to the second reference point (point Z in Figure 1). Thus the end-to-end loss measurementcorresponds to the difference between both reference values (end-to-end loss measurement = B - Z). Figure 1. An OTDR loss measurement with an infinitely small pluse
If the light pulses were infinitely small, the end-to-end loss measurement would correspond to the value given above. However, infinitely smalllight pulses are only theoretical. In actual measurements, an OTDR is exposed to what are known as dead zones, which are temporarysaturations of the APD following a reflective event; these saturations prevent the detector from registering or measuring another event. There are two types of dead zones:
event dead zone: distance in which an OTDR cannot detect an event following a reflective event
attenuation dead zone: distance in which the OTDR cannot measure an event following a reflective event
Let us illustrate this idea using the parameters described in Figure 1, but this time the light pulse will be 100 m long (as shown in Figure 2). If the first event is located at a distance of more than 100 m from the beginning of the fiber, an event dead zone will cause a temporary blindingof the OTDR for a distance of at least 100 m. Instead of taking the attenuation of the first fiber section and extrapolating this curve to the y-axis, this temporary blinding will cause the OTDR to display a trace that uses the attenuation of the second fiber section. The OTDR willextrapolate its line all the way to the y-axis, and, therefore will not include the loss caused by the attenuation of the first fiber section nor theloss caused by the connector placed 100 m from the beginning of the fiber.
To avoid this problem and include the first splices in the end-to-end loss measurement, extra precautions must be taken during measurementtesting. These include adding dummy fiber before the first events or splices; the dummy fiber enables the OTDR to generate a slope causedby Rayleigh backcattering before the splices or loss events come into play. Without this slope, the OTDR does not have a reference point toaccount for the extra loss caused by the splices or events, thus causing the OTDR trace to start at a lower level. With the slope, the OTDR
can measure the vertical distance between the line with the slope before the splice or events and the line with the slope after the splices orevents. To insert this piece of fiber without including it in your final trace, EXFO's OTDR software is equipped with the Span Start feature; thisfeature enables you to place a marker immediately before the first splice or event to indicate where to start the OTDR trace.
Similarly, if an event is located within 100 m of the end of the fiber and if the light pulse is 100 m long, the OTDR's end-to-end loss value willnot correspond to the total loss of the fiber under test (Figure 3). Indeed, when the light pulse hits this last connector, the event dead zoneprevents the OTDR from detecting any other events until the signal reaches the noise floor. Once it reaches the noise floor, the OTDRdetermines the last detected event. The OTDR then returns to the point immediately before the last event and draws a horizontal line. In thissituation, the loss caused by the last fiber section as well as the loss of the last connector would not be included in the trace.
To avoid this situation, use a section of dummy fiber at the end of the fiber; this enables the OTDR to include losses and measure splices thatare located very near the end of the fiber. To insert this piece of fiber without including it in your final trace, again EXFO's OTDR Span Endsoftware feature enables you to place a marker indicating where to end the OTDR trace. How Much Time Do You Have?
Another factor to consider is how much time each instrument takes to test a fiber. With OTDRs, there is a unit at one end of the link, so youmeasure only one direction at a time. Further, to eliminate as much noise as possible, the acquisition time parameter, (or the amount of timenecessary to average points on the OTDR trace), should be as long as possible; EXFO recommends three minutes. The result? To measure asingle fiber in both directions, you will have to wait six minutes before you obtain bidirectional measurements. With an OLTS—and in particular,with the FasTesT—you can obtain bidirectional results in less than 30 seconds. Imagine the time you could save if you had to test a cablecontaining 144 fibers (144 cables multiplied by an extra 5 1/2 minutes per cable means 792 minutes (over 13 hours) of saved testing time). Figure 2. OTDR loss measurement with a 100 m pluseDifferences in Accuracy
Another important parameter to examine is OTDR linearity, which is defined in dB/dB. To explain this concept, let's assume that an OTDR hasdetected a loss of 1 dB. Given a linearity of 0.05 dB/dB, the actual loss might be anywhere from 0.95 dB to 1.05 dB. If we have a loss of20 dB and the same linearity as before, actual loss might be anywhere between 19.0 dB to 21.0 dB. Thus, the loss figure could be off by asmuch as 1.0 dB. This degree of inaccuracy would be the worst-case scenario at every point along the line; values between 19.5 dB and 20.5 dB, or ± 0.5 dB inaccuracy, would be more likely.
On the other hand, OLTSs employ a technology, known as logarithmic amplification, to improve accuracy. Logarithmic amplification is providedby amplifier stages; a wide dynamic range is achieved by using multiple amplifier stages, with a processor that automatically selects theappropriate scale. Each scale has its own set of calibration parameters stored in the unit's EEPROM (internal software). You end up withaccurate dBm and watt readings at multiple calibrated wavelengths. The unit's accuracy corresponds to the maximum variation from a powerreading level with respect to the absolute reading, as established by a standards institute such as ANSI. The power meter's linearitycorresponds to the relative variation over the full dynamic range between the power input and power displayed by the unit. Measurement Ranges Compared
We should remember that the linearity specification for an OTDR is valid only within its specific measurement range. The measurement rangeis taken as the distance from the launching point all the way to the point where the OTDR can measure a splice of 0.5 dB with an accuracyof 0.1 dB. This said, several OTDR models, each with separate measurement ranges, are now on the market. For example, among EXFO'sOTDRs, the maximum value for a measurement range is 32 dB. However, if you look at EXFO's FOT-920 MaxTester (an OLTS) the dynamicrange is better than 65 dB. This means you can measure an extra 33 dB of loss with an OLTS, more specifically, with the FOT-920 MaxTester. For example, if you need to test singlemode fiber with a typical loss of 0.2 dB/km, you would be able to test an extra 165 km with the FOT-920 MaxTester, compared to a 32 dB OTDR. Figure 3. Without a dummy fiber, an OTDR cannot measures loss events near the fiber end.Conclusion
Even though both the OTDR and the OLTS provide measurements of the optical loss of the fiber under test, understanding how eachinstrument works enables you to take the necessary precautions to obtain a reading that suits your testing needs, thus avoiding situations inwhich the optical link has greater loss than what is displayed by the test equipment.
OTDR measurements are essential for charting link loss against distance; this is, in fact, why OTDRs are so popular among outside plantusers. However, the OLTS method remains important too because it is the only method that provides accurate results for total loss in the fiberlink under test. Armed with this knowledge, you can now avoid erroneous readings and unnecessary downtime by making informed choicesabout which instrument to use and when to use it.
Corporate Headquarters > 400 Godin Avenue, Vanier (Quebec) G1M 2K2 CANADA
Tel.: 1 418 683-0211 Fax: 1 418 683-2170
Toll-free: 1 800 663-3936 (USA and Canada)
151 Chin Swee Road, #03-29 Manhattan House
Beijing New Century Hotel Office Tower Room 1754-1755
2005 EXFO Electro-Optical Engineering Inc. All rights reserved.
Inflammation, Vol. 30, No. 6, December 2007 (# 2007)DOI: 10.1007/s10753-007-9041-3The Effects of High Dose Pravastatin and Low DosePravastatin and Ezetimibe Combination Therapy on Lipid,Glucose Metabolism and InflammationNecati Dagli,1,2 Mustafa Yavuzkir,1 and Ilgin Karaca1Objective. Coronary artery disease (CAD) is presently the major cause of mortality and morbidity. Anti-hyperlipidemic treat
Bol. Soc. Paran. Mat. (3s.) v. 23 1-2 (2005): On the index complex of a maximal subgroup and the group-theoreticabstract: Let G be a finite group, Sp ( G ) , Φ ( G ) and Φ1( G ) be generalizationsof the Frattini subgroup of G . Based on these characteristic subgroups and usingDeskins index complex, this paper gets some necessary and sufficient conditions for G to be a p -solvable, π -
 A Detailed Look at OTDR Loss Measurements
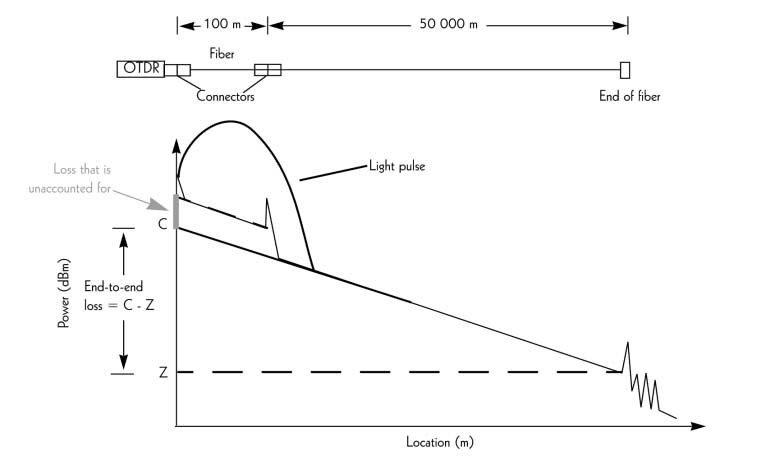 can measure the vertical distance between the line with the slope before the splice or events and the line with the slope after the splices orevents. To insert this piece of fiber without including it in your final trace, EXFO's OTDR software is equipped with the Span Start feature; thisfeature enables you to place a marker immediately before the first splice or event to indicate where to start the OTDR trace.
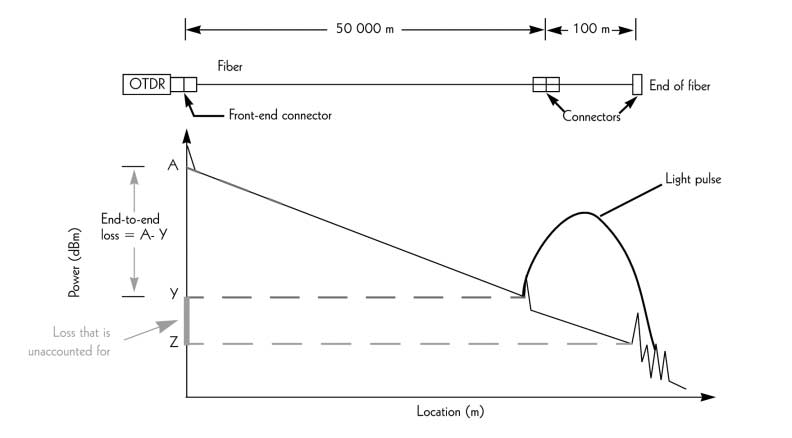 Differences in Accuracy