SUPPORTING INFORMATION Applications of high-resolution electrospray ionization mass spectrometry to measurements of average oxygen to carbon ratios in secondary organic aerosols Adam P. Bateman,a Julia Laskin,b and Alexander Laskin,c Sergey A. Nizkorodova* a Department of Chemistry, University of California, Irvine, Irvine, California 92617, USA. b Chemical and Materials Sciences Division, Pacific Northwest National Laboratory, Richland, c Environmental Molecular Sciences Laboratory, Pacific Northwest National Laboratory,
* Corresponding author: Sergey Nizkorodov Tel: +1-949-824-1262Table S1. Number of ESI mass spectra collected for each sample for each ESI mode. The same number
of ESI mass spectra were collected at each dilution for Mixtures A – F.
Table S2. Adjusted parameters used for the determination of O/C ratio in the Analytical Procedure for
Elemental Separation (APES) from HR-AMS-ToF datThe ratios of ions were obtained from single
runs, rather than an average over the entire sampling time, and verified at various times throughout the
reaction period. A relative ionization efficiency (R.I.E.) for the HR-AMS-ToF data of 1.0 was used for
water and R.I.E. of 1.4 was used for organics.
(H2O+)org:(CO2 )org (H2O+)org:(OH+)org:(O+)org
Table S3. The relative ESI sensitivity of each standard for each dilution averaged across all mixtures for
each ionization mode. Each compound’s ESI sensitivity has been scaled relative to (+) mode cis-
pinonic acid. The ratios of (+) mode sensitivities to (-) mode sensitivities are also listed. Table S1
provides evidence for significant matrix effects. For example, in the (+) mode, succinic acid and DL-
malic acid are only observed at the lowest concentration level, while citric acid only appears in the mass
spectra corresponding to the highest concentration. All compounds are detectable in the (-) mode at all
Table S4. Compounds used in analysis of solution O/C using ESI-MS are tabulated with corresponding
structures, molecular formulas, o/c ratios, and calculated log P values, experimental log P values are listed
in parentheses were available. Prediction of log P was performed using ACD/ChemSketch Freeware
version 12.01 (Advanced Chemical Development Inc., Toronto, Canada). Experimentally measured
values of log P where used if they were available, and they agreed well with the predicted values.
Table S5. Previously identified compounds in limonene SOA using GC-are tabulated with
corresponding structures, molecular formulas, o/c ratios, and calculated log P values. Limononaldehyde
(C10H16O2) was not detected in the negative ion mode, therefore it was not included in Figure 3.
Compounds with the same elemental formulae (C9H14O3, C10H16O3, and C9H14O4) could not be
distinguished in the HR ESI-MS, therefore the average log P value was used in Figure 4.
Table S6. O/C values estimated for HR ESI-MS dataset obtained from the dark ozonolysis of limonene
The error has been calculated based on multiple samples and ES ionization efficiencies and propagated
Table S7. O/C values estimated for HR ESI-MS dataset obtained from the dark ozonolysis of isoprene
Also listed are O/C values measured from online ToF-AMS of the chamber aerosol.
Figure S1. Average relative ionization efficiency factors scaled to (+) mode pinonic acid plotted against
each compound’s o/c ratio for (+) and (-) mode. As this figure demonstrates, there is no obvious
References
Chen, Q.; Liu, Y. J.; Donahue, N. M.; Shilling, J. E.; Martin, S. T., Particle-Phase
Chemistry of Secondary Organic Material: Modeled Compared to Measured O:C and H:C Elemental Ratios Provide Constraints. Environ. Sci. Technol. 2011,45 (11), 4763-4770. 2.
Aiken, A. C.; Decarlo, P. F.; Kroll, J. H.; Worsnop, D. R.; Huffman, J. A.; Docherty, K.
S.; Ulbrich, I. M.; Mohr, C.; Kimmel, J. R.; Sueper, D.; Sun, Y.; Zhang, Q.; Trimborn, A.; Northway, M.; Ziemann, P. J.; Canagaratna, M. R.; Onasch, T. B.; Alfarra, M. R.; Prevot, A. S. H.; Dommen, J.; Duplissy, J.; Metzger, A.; Baltensperger, U.; Jimenez, J. L., O/C and OM/OC ratios of primary, secondary, and ambient organic aerosols with high-resolution time-of-flight aerosol mass spectrometry. Environ. Sci. Technol. 2008,42 (12), 4478-4485. 3.
Glasius, M.; Lahaniati, M.; Calogirou, A.; Di Bella, D.; Jensen, N. R.; Hjorth, J.; Kotzias,
D.; Larsen, B. R., Carboxylic acids in secondary aerosols from oxidation of cyclic monoterpenes by ozone. Environ. Sci. Technol. 2000,34 (6), 1001-1010. 4.
Leungsakul, S.; Jaoui, M.; Kamens, R. M., Kinetic mechanism for predicting secondary
organic aerosol formation from the reaction of d-limonene with ozone. Environ. Sci. Technol. 2005,39 (24), 9583-9594. 5.
Nguyen, T. B.; Bateman, A. P.; Bones, D. L.; Nizkorodov, S. A.; Laskin, J.; Laskin, A.,
High-resolution mass spectrometry analysis of secondary organic aerosol generated by ozonolysis of isoprene. Atmospheric Environment 2010,44 (8), 1032-1042.
D o s s i e r : o b é s i t é A la recherche de la potion magique Keywords: obesity – children – adolescents – drug therapy – orlistat – sibutramin – rimonabant – metformin Le traitement médicamenteux Introduction En combinaison avec sa prescription, une de l’obésité est pratiqué depuis A la recherche de la potion magique: la alimentation pauvre en graisse
Il Tuo Programma Benessere Con l’esclusiva e unica Miscela brevettata LeptiKey SCOPI E OBIETTIVI 1 . Per prima cosa occorre stabilire che è un "programma" costruito su basi clinico-scientifiche e non un semplice e singolo trattamento dimagrante. 2 . Il primo programma che può vantare la reale possibilità di agire direttamente sulla SINDROME METABOLICA, SULLA LEPTINA, SULLA
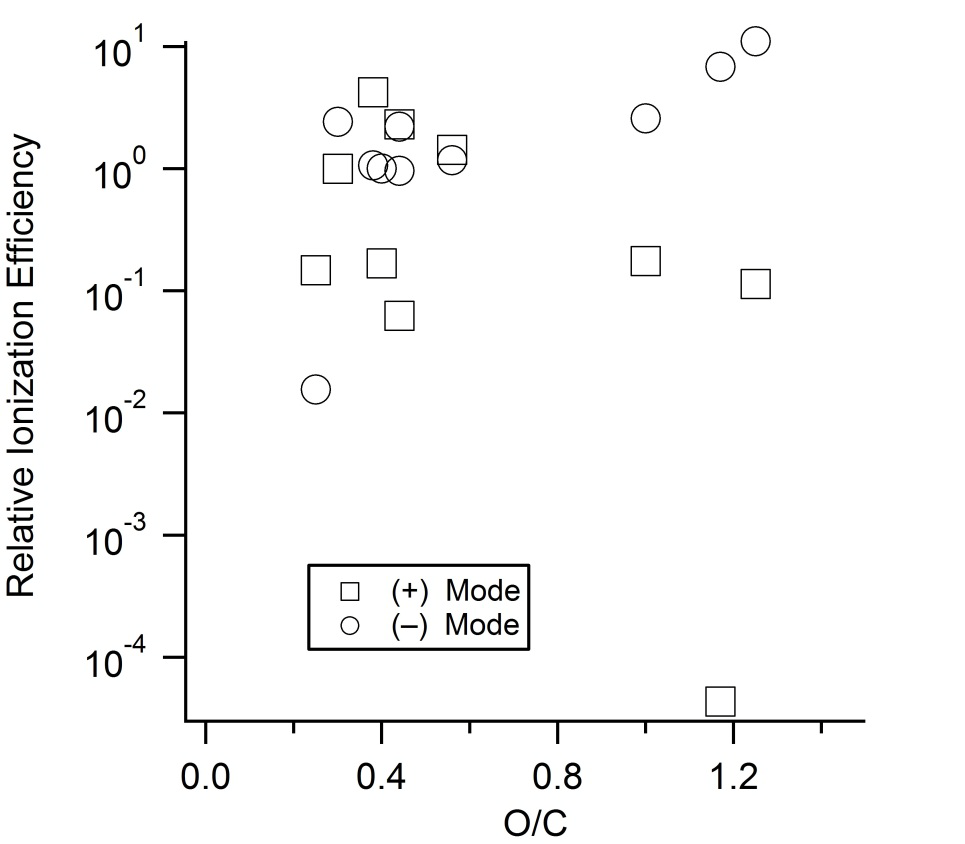 Figure S1. Average relative ionization efficiency factors scaled to (+) mode pinonic acid plotted against